2013 pool statistics show DAs up 2% on 2012
 The traditionally slow end-of-year period (in terms of approving DAs, not actual pool projects being constructed) has seen December DAs down slightly on last year. A more relevant measure is probably to look at the entire 2013 compared to 2012, which shows a modest two per cent increase.
Over the 12 months, New South Wales and South Australia stayed relatively steady (both down 1 per cent) while Victoria was down 19 per cent. Queensland was up a massive 47 per cent but off a very bad year in 2012. This represented an extra 390 pool DAs for Queensland over the previous year. WA was up 14 per cent, which represented 353 more pool DAs approved over 2013 than 2012.
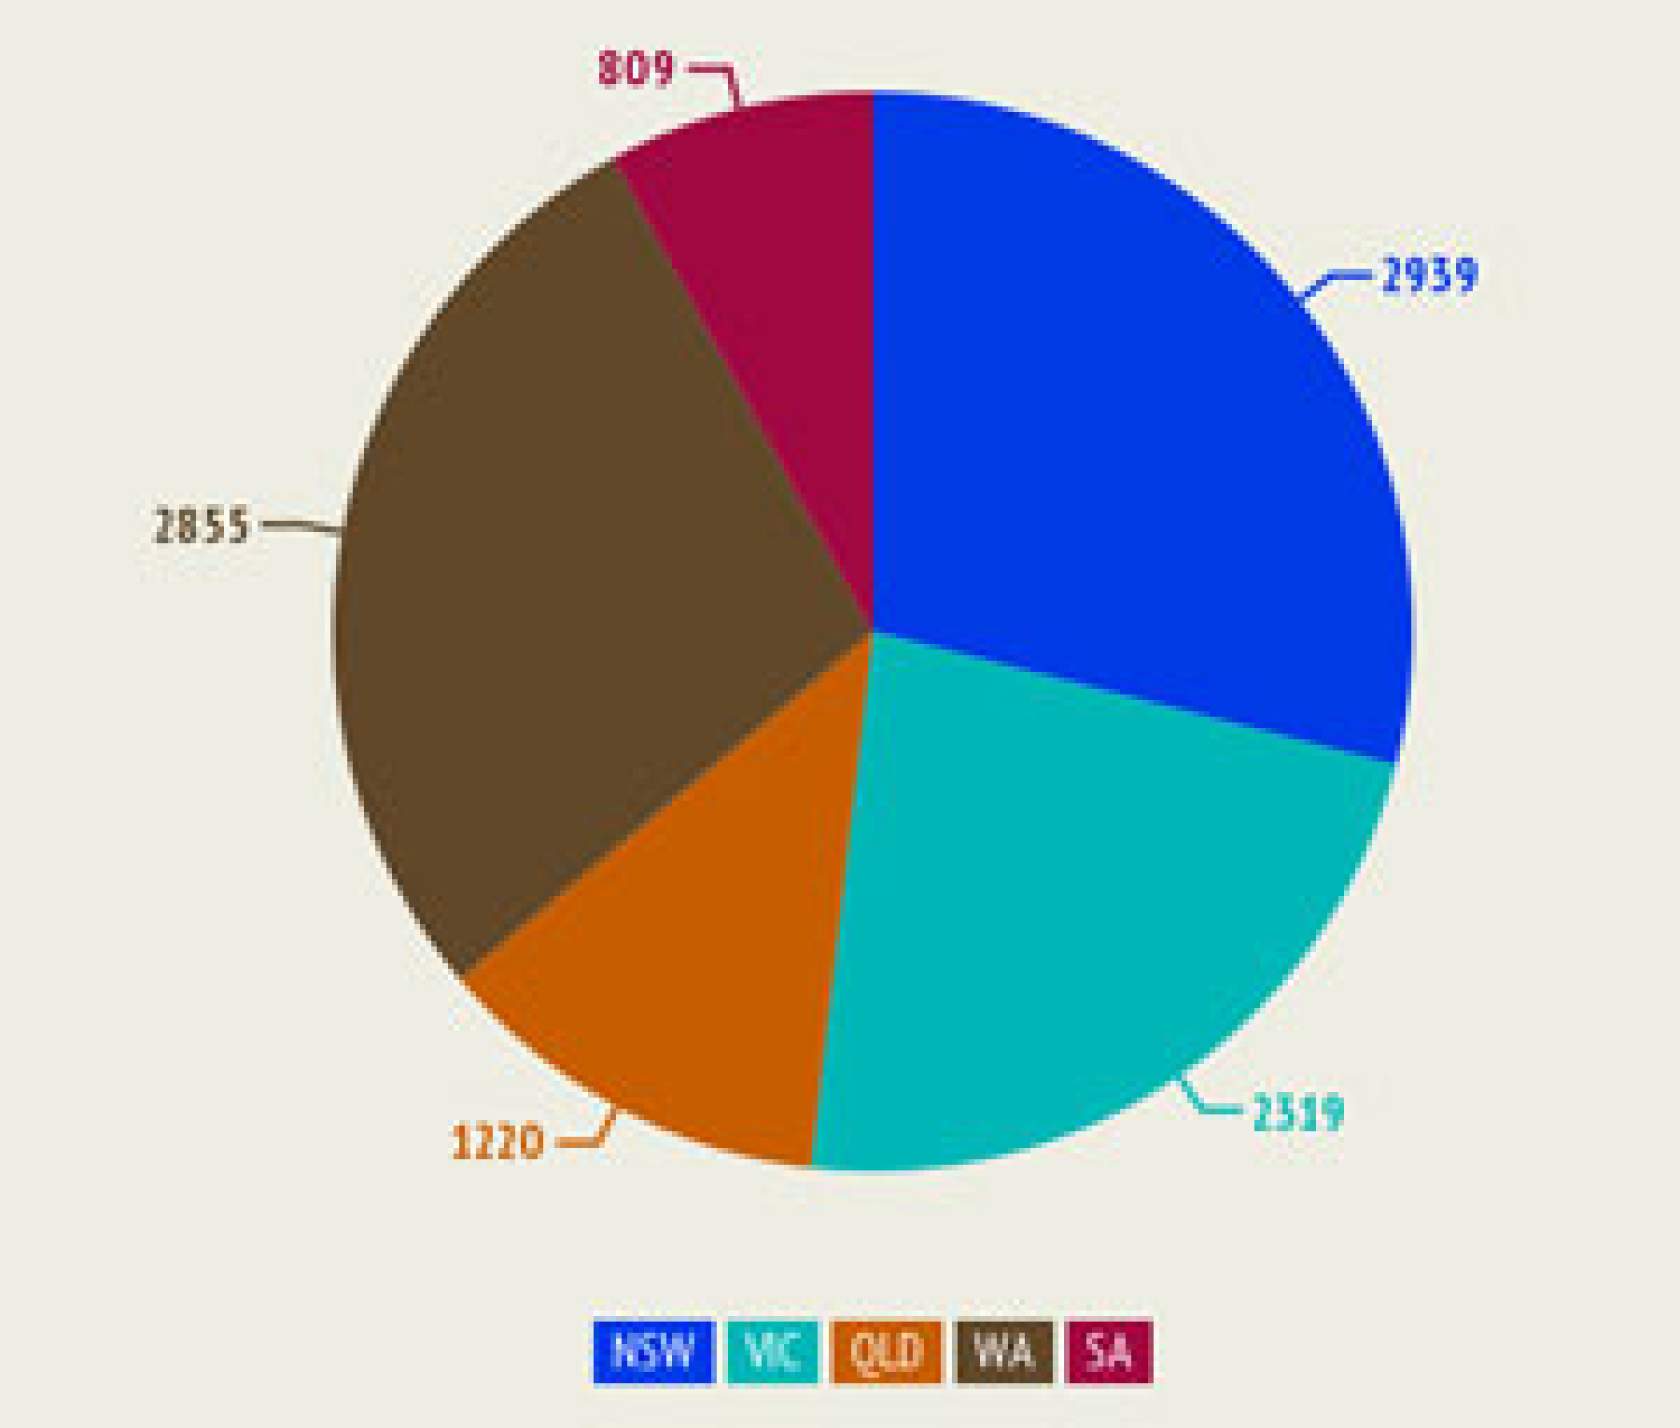
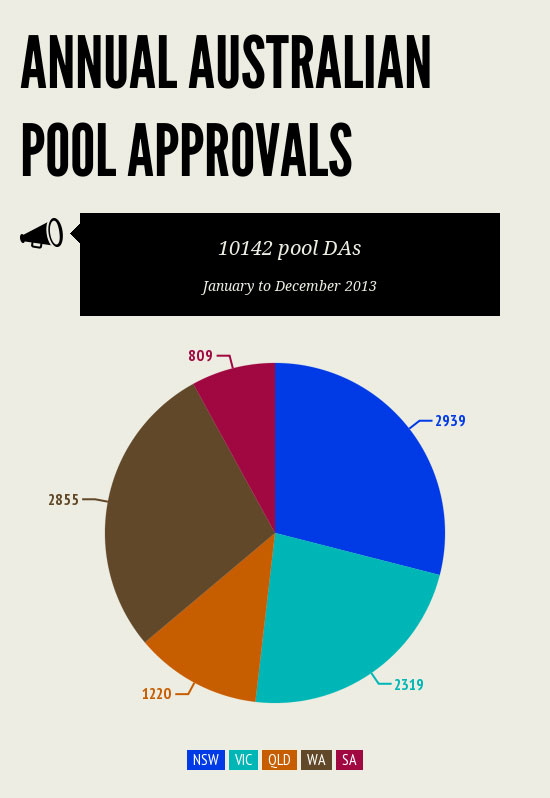
Totals for the year were:
NSW: 2939;
VIC: 2319;
QLD: 1220;
WA: 2855;
SA: 809.
Total: 10,142
Please note that actual total DAs for Queensland may be higher than numbers shown here, because councils are more reticent to hand over information in that State – but the trend information should still be consistent.
These figures give a valuable indication of the way the market is trending. However, they are not comprehensive. For example, they do not include pool projects that are approved as part of a new home, smaller projects under the cost threshold, or renovations that don’t require a DA. Also, not all councils are forthcoming with data; councils in some states such as Queensland are particularly reluctant. For further information and more complete reports, call Cordell Information on 1800 80 60 60.
Keep informed with the free SPLASH! newsletter or follow SPLASH! on social media:Twitter, Facebook, LinkedIn and Google+.