Drowning numbers slightly down but more to be done


Royal Life Saving has released its National Drowning Report 2014, showing improvement in some areas.
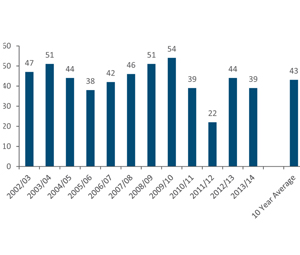
Again, swimming pools feature prominently as do children under five years old, although there has been some slight progress in both groups.The target is to reduce 0-4 year old drowning deaths to no more than 17 per year by 2020, and this year’s result of 20 shows some progress.In all, there were 39 drowning deaths in swimming pools in 2013/14.
This figure is a reduction of four drowning deaths (or nine per cent) on the 10 year average of 43 drowning deaths (see Graph 1). Men accounted for 72 per cent of all drowning deaths in swimming pools in the 2013/14 financial year.
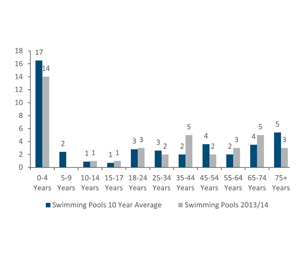
Children aged under five continue to be the age group that accounts for the largest number of drowning deaths in swimming pools in Australia, with 14 drowning deaths in 2013/14 or 36 per cent of all drowning deaths in swimming pools. The 14 drowning deaths in the 0-4 years age group represents an 18 per cent reduction on the 10 year average of 17 drowning deaths (See Graph 2).

The largest increase in drowning deaths in swimming pools was recorded in the 35-44 years age group with the five drowning deaths seen in this age group representing an increase of 150 per cent against the 10 year average of two drowning deaths (See Graph 2).Falls into water accounted for almost half (49 per cent) of all drowning deaths in swimming pools in 2013/14.
Swimming and recreating was the next leading activity prior to drowning in swimming pools, accounting for 41 per cent of swimming pool drownings in 2013/14.
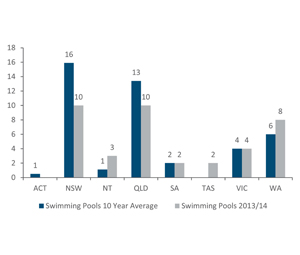
Reductions against the 10 year average for swimming pool drowning deaths were recorded in New South Wales and Queensland, with reduction of 38 per cent and 23 per cent respectively.

The Northern Territory and Western Australia both recorded increases in 2013/14 against the 10 year average for their State or TerritorySwimming pool drowning deaths increased by 200 per cent in the Northern Territory and by 33 per cent in Western Australia (See Graph 3).
Children under five continue to account for a large proportion of drowning deaths in swimming pools, particularly home swimming pools.
Royal Life Saving says in its report that it is important to ensure that home pools are fenced with a correctly installed compliant pool fence with a self-closing and self-latching gate.
It says consumers should be alert and never prop the gate open or leave objects that could be climbed on near the fence. Pool owners should regularly check their pool fence, gate and surrounds as the strength and integrity of the structure can weaken over time and exposure to the elements.
2014 Snapshot of findings
Overall
• 266 people drowned in Australia between 1 July 2013 and 30 June 2014
• This is a reduction of 29 drowning deaths (or 10 per cent) on the adjusted total of 295 drowning deaths in 2012/13
• This is a reduction of 26 drowning deaths (or nine per cent) on the 10 year
average of 292 drowning deaths
Sex and age
• 81 per cent of all drowning deaths were male (215 drowning deaths)
• 19 per cent of all drowning deaths were female (51 drowning deaths)
• 20 (eight per cent) drowning deaths occurred in children aged 0-4 years
• 10 (four per cent) drowning deaths occurred in children aged 5-14 years
• 40 (15 per cent) drowning deaths occurred in young people aged 15 to 24 years
• 87 (33 per cent) drowning deaths occurred in people aged 55 years and over
State and Territory
• 90 (34 per cent) drowning deaths ocurred in New South Wales
• 60 (23 per cent) drowning deaths occurred in Queensland
• 47 (18 per cent) drowning deaths occurred in Victoria
Location and activity
• 105 (39 per cent) drowning deaths occurred in inland waterway locations
• 39 (15 per cent) drowning deaths occurred in swimming pools
• 34 (13 per cent) drowning deaths occurred at beaches
• 65 people (24 per cent) were swimming and recreating immediately prior to drowning
• 56 people (21 per cent) drowned as a result of falls into water
• 43 people (16 per cent) were using watercraft immediately prior to drowning
For the full report go here: National Drowning Report 2014
Keep informed with the free SPLASH! newsletter or follow SPLASH! on social media: Twitter, Facebook, LinkedIn and Google+.


