Year-to-January pool numbers down slightly
 January 2014 figures showed a slight correction after the calendar year figures showed a gain of two per cent.
Figures comparing the 12 months to January 2014 with the previous 12 months show the year down one percent, on the back of a slightly slower January with six per cent less pool DAs.
On the 12months-to-January comparisons, Queensland again showed the most improvement, up 25 per cent to 1144 DAs.
New South Wales had the most at 3081, an improvement of three per cent, while Western Australia was up 11 per cent to 2851. Both Victoria, down 22 per cent to 2192, and South Australia, down eight per cent to 796, showed declines.
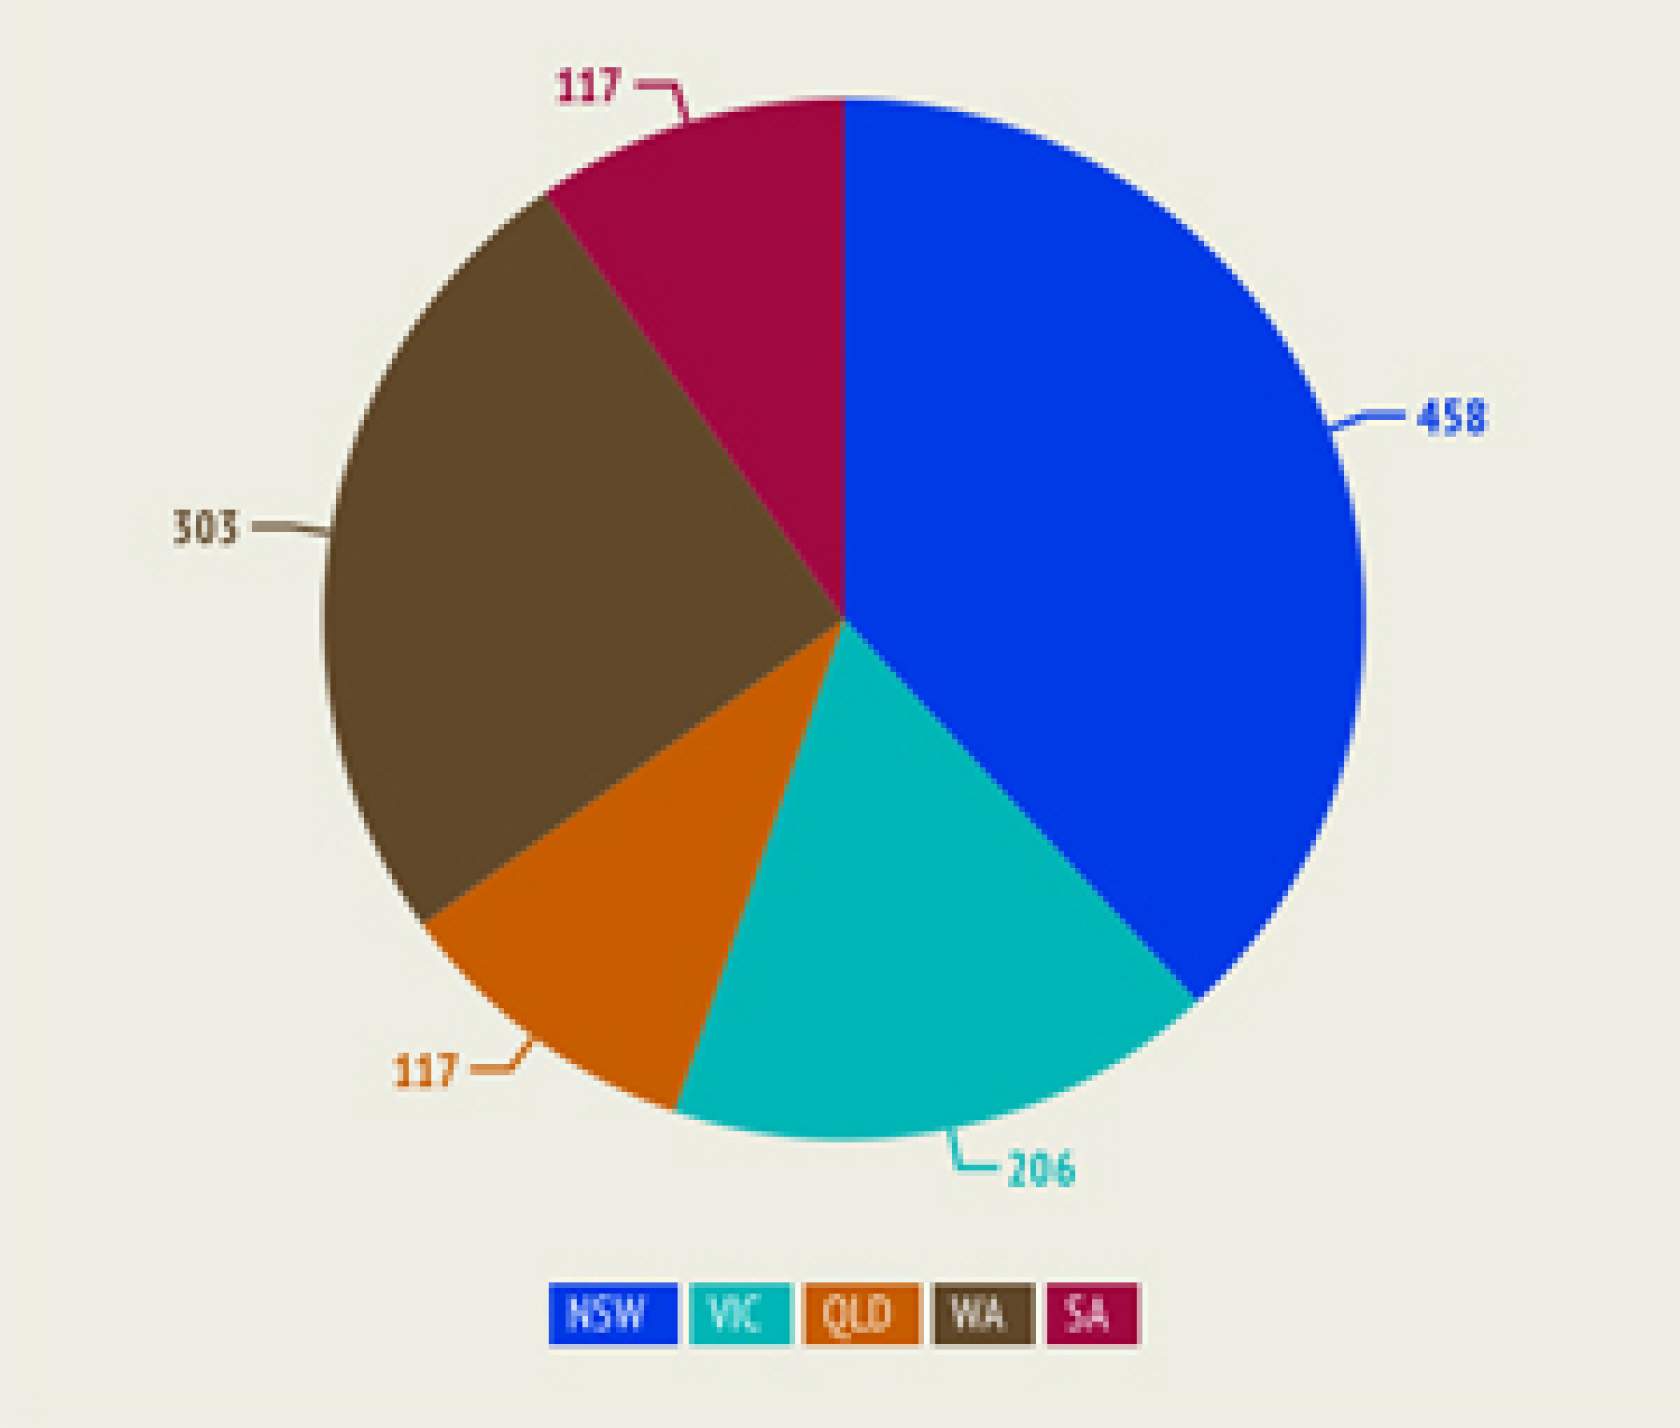
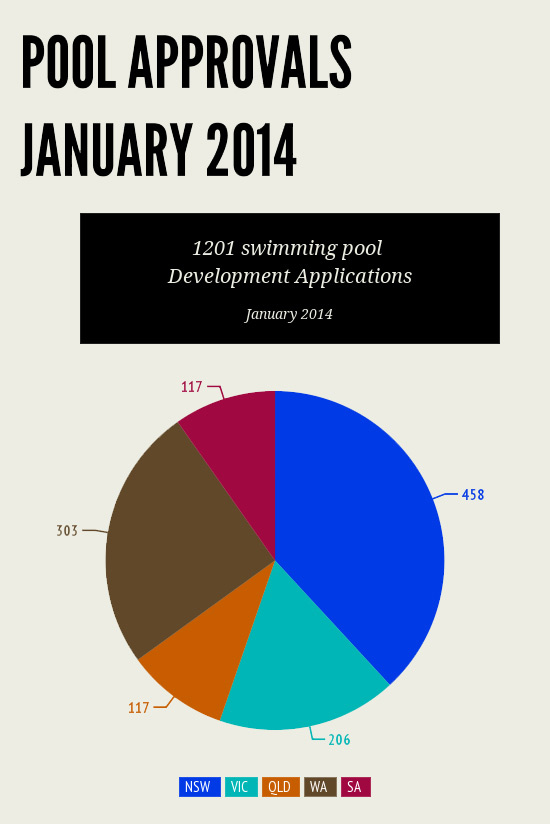
January DA figures
NSW: 458
WA: 303
VIC: 206
QLD: 117
SA: 117
Please note that actual total DAs for Queensland may be higher than numbers shown here, because councils are more reticent to hand over information in that State – but the trend information should still be consistent.
These figures give a valuable indication of the way the market is trending. However, they are not comprehensive. For example, they do not include pool projects that are approved as part of a new home, smaller projects under the cost threshold, or renovations that don’t require a DA. Also, not all councils are forthcoming with data; councils in some states such as Queensland are particularly reluctant. For further information and more complete reports, call Cordell Information on 1800 80 60 60.
Keep informed with the free SPLASH! newsletter or follow SPLASH! on social media:Twitter, Facebook, LinkedIn and Google+.